
As the name suggests, the Random forest is a “forest” of trees! i.e Decision Trees. A random forest is a tree-based machine learning algorithm that randomly selects specific features to build multiple decision trees. The random forest then combines the output of individual decision trees to generate the final output. Now, let’s start our today’s topic on random forest from scratch.
Decision trees involve the greedy selection to the best split point from the dataset at each step. We can use random forest for classification as well as regression problems. If the total number of column in the training dataset is denoted by p :
- We take sqrt(p) number of columns for classification
- For regression, we take a p/3 number of columns.
WHEN TO USE RANDOM FOREST ?
- When we focus on accuracy rather than interpretation
- If you want better accuracy on the unexpected validation dataset
HOW TO USE RANDOM FOREST ?
- Select random samples from a given dataset
- Construct decision trees from every sample and obtain their output
- Perform a vote for each predicted result.
- Most voted prediction is selected as the final prediction result.

Source: javapoint
A decision tree is essentially a series of if-then statements, that, when applied to a record in a data set, results in the classification of that record. We have covered all mathematical concepts and a project from scratch with a detailed explanation. CLICK FOR MORE
STOCK PREDICTION USING RANDOM FOREST
In this tutorial of Random forest from scratch, since it is totally based on a decision tree we aren’t going to cover scratch tutorial. You can go through decision tree from scratch.
import matplotlib.pyplot as plt
import numpy as np
import pandas as pd

# Import the model we are using
from sklearn.ensemble import RandomForestRegressor

data = pd.read_csv('data.csv')
data.head()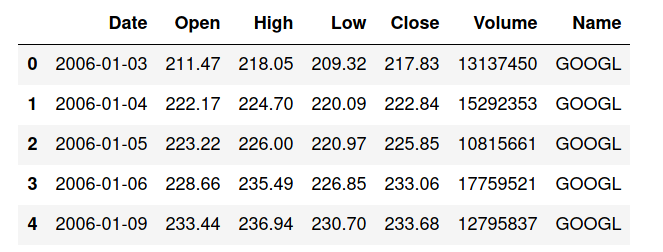
Here, we will be using the dataset (available below) which contains seven columns namely date, open, high, low, close, volume, and name of the company. Here in this case google is the only company we have used. Open refers to the time at which people can begin trading on a particular exchange. Low represents a lower price point for a stock or index. High refers to a market milestone in which a stock or index reaches a greater price point than previously for a particular time period. Close simply refers to the time at which a stock exchange closes to trading. Volume refers to the number of shares of stock traded during a particular time period, normally measured in average daily trading volume.
abc=[]
for i in range(len(data)):
    abc.append(data['Date'][i].split('-'))
    data['Date'][i] = ''.join(abc[i])
Using above dataset, we are now trying to predict the ‘Close’ Value based on all attributes. Let’s split the data into train and test dataset.
Now, let’s instantiate the model and train the model on training dataset:
rfg = RandomForestRegressor(n_estimators= 10, random_state=42)
rfg.fit(X_train_1,y_train_1)
Let’s find out the features on the basis of their importance by calculating numerical feature importances
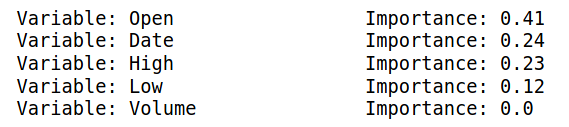
rfg.score(X_test_1, y_test_1)

output:- 0.9997798214978976
We are getting an accuracy of ~99% while predicting. We then display the original value and the predicted Values.
pd.concat([pd.Series(rfg.predict(X_test_1)), y_test_1.reset_index(drop=True)], axis=1)ADVANTAGES OF RANDOM FOREST
- It reduces overfitting as it yields prediction based on majority voting.
- Random forest can be used for classification as well as regression.
- It works well on a large range of datasets.
- Random forest provides better accuracy on unseen data and even if some data is missing
- Data normalization isn’t required as it is a rule-based approach
DISADVANTAGES
- Random forest requires much more computational power and memory space to build numerous decision trees.
- Due to the ensemble of decision trees, it also suffers interpretability and fails to determine the significance of each variable.
- Random forests can be less intuitive for a large collection of decision trees.
- Using bagging techniques, Random forest makes trees only which are dependent on each other. Bagging might provide similar predictions in each tree as the same greedy algorithm is used to create each decision tree. Hence, it is likely to be using the same or very similar split points in each tree which mitigates the variance originally sought.


You made some nice points there. I did a search on the theme and found mainly people will have the same opinion with your blog.
Heya i’m for the first time here. I found this board and I to find It really helpful & it helped me out much. I’m hoping to provide something again and aid others like you helped me.
504676 89303Utterly composed subject material , thanks for selective information . 789806
It is truly a great and helpful piece of info. I’m satisfied that you shared this useful information with us. Please keep us informed like this. Thank you for sharing.
you’re really a good webmaster.
Cheers
Definitely. Thanks
naturally like your web site
You made some decent points there. I looked on the internet for the topic and found most people will approve with your website.