Regression analysis is a powerful statistical method used to quantify the average relationship between two or more continuous variables. It helps us understand how the response variable (dependent variable) is influenced by one or more feature variables (independent variables). In essence, regression analysis seeks to unveil the nature of the relationship between these variables, enabling us to make predictions about the likely values of the dependent variable based on given values of the independent variables. One of the most commonly employed regression techniques is linear regression.
To illustrate the practical application of regression, consider a scenario where there’s a strong correlation between the daily temperature and the sales of tea and coffee. In such a case, a store owner may want to predict the temperature for the next day to make informed decisions about stocking tea and coffee. Regression analysis can provide valuable insights and predictions in such situations.
In regression analysis, the dependent variable is the one we aim to estimate, predict, or influence. It represents the outcome we are interested in. Conversely, the independent variable, also known as the explanatory, regressor, or predictor variable, is the variable we use to make predictions or understand the relationships better. By studying how these variables interact, we gain valuable insights that can inform decision-making and enhance our understanding of various phenomena.
LINEAR REGRESSION
Linear Regression is a supervised machine learning method designed to establish a connection between a set of continuous variables within a given dataset. Essentially, it addresses the challenge of finding the most optimal linear representation, which could be a line in two dimensions, a plane in three dimensions, or a hyperplane in higher dimensions, that best describes the relationship present within the data.
This algorithm leverages statistical techniques applied to a training dataset to determine the ideal linear or straight-line relationship between the input variables (often denoted as X) and the output variable (commonly referred to as y). The objective is to create a linear equation that can predict the values of the output variable based on the input variables. This equation captures the underlying patterns and trends in the data, allowing for accurate predictions and valuable insights into the relationships between the variables. Linear Regression is a fundamental tool in the field of machine learning and data analysis, and its applications span across various domains, from economics to engineering and beyond.
Simple equation of the Linear Regression model can be written as:
Y=mX+c ;Here m and c are calculated on trainingIn the equation mentioned earlier, several key components play pivotal roles in the Linear Regression model:
– **m**: This represents the scale factor or coefficient, often referred to as the slope of the line. It quantifies the degree and direction of the relationship between the independent variable (X) and the dependent variable (Y). A higher magnitude of ‘m’ indicates a steeper slope and a stronger influence of the independent variable on the dependent variable.
– **c**: This is the bias coefficient or the y-intercept. It determines the point at which the line intercepts the vertical axis when the independent variable (X) is zero. ‘c’ provides an offset or bias to the linear relationship, allowing the model to capture any inherent bias in the data.
Once the values of ‘m’ and ‘c’ are determined through the training process of Linear Regression, the resulting equation, often denoted as Y = mx + c, becomes a powerful predictive tool. With this equation, you can make predictions of the dependent variable (Y) for given values of the independent variable (X). It allows you to estimate how changes in the independent variable(s) will affect the dependent variable(s), enabling you to make informed decisions and forecasts based on the learned relationships in your data. Linear Regression is a versatile and widely used technique for tasks like prediction, trend analysis, and understanding correlations between variables in various fields.
Mathematically, coefficients m and c can be calculated as:
m = sum((X(i) - mean(X)) * (Y(i) - mean(Y))) / sum( (X(i) - mean(X))^2 )
c = mean(Y) - m * mean(X)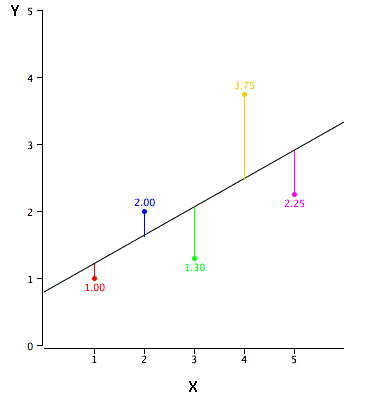
The illustration shows that the red data point closely aligns with the regression line, resulting in a small prediction error. Conversely, the yellow data point deviates significantly above the regression line, leading to a considerable prediction error. The optimal fit is achieved by the line that minimizes the total sum of squared prediction errors.
LINEAR REGRESSION IN MATRIX
Linear regression in matrix notation is a concise way to represent the relationship between dependent and independent variables while accounting for multiple data points. We will cover both simple linear regression and multiple linear regression in matrix form.
1. Simple Linear Regression in Matrix Form:
In simple linear regression, you have one independent variable (x) and one dependent variable (y). The goal is to find the best-fit line represented by (y = b0 + b1.x) that minimizes the sum of squared errors.
In matrix form, we represent this as:
Y = Xβ +ε
- -> Y is a column vector of dependent variables (observations of y, where each row corresponds to a data point. It has dimensions Nx1, where N is the number of data points.
- -> X is a matrix of independent variables (observations of x, where each row corresponds to a data point. It has dimensions Nx2. The first column is typically filled with 1s (for the intercept), and the second column contains the values of x.
– β is a column vector of coefficients, where β0 is the intercept, and β1 is the slope. It has dimensions 2×1.
– ε is a column vector of errors (residuals), representing the difference between the observed values Y and the predicted values Xβ. It has dimensions Nx1.
So, the task in simple linear regression is to find the values of β that minimize the sum of squared errors:

2. Multiple Linear Regression in Matrix Form:
In multiple linear regression, you have multiple independent variables (x1,x2,…) and one dependent variable, y. The goal is to find the best-fit hyperplane represented by:
y=b0+b1.x1+b2.x2+……..+bp.xp
In matrix form, we represent this as:
Y = X.β + ε
– Y is a column vector of dependent variables (observations of y , as described earlier.
– X is a matrix of independent variables (observations of x1,x2,x3…xp) where each row corresponds to a data point. It has dimensions Nx (p+1), with the first column filled with 1s (for the intercept) and subsequent columns containing x1,x2,x3…xp values.
– β is a column vector of coefficients, where β0 is the intercept, and β1, β2,……., βp are the coefficients for x1,x2,x3…xp. It has dimensions (p+1)x1.
– ε is a column vector of errors (residuals), as described earlier.
The task in multiple linear regression is to find the values of β that minimize the sum of squared errors:
Matrix notation allows for a more compact and generalized representation of both simple and multiple linear regression, making it easier to understand and work with when dealing with large datasets and multiple independent variables.
LINEAR REGRESSION FROM SCRATCH
We will build a linear regression model to predict a person’s salary based on years of experience from scratch. You can download the dataset from the link given below. Let’s start with importing the required libraries:
%matplotlib inline
import numpy as np
import matplotlib.pyplot as plt
import pandas as pd
We use a dataset of 30 data items consisting of years of experience and salary. Let’s visualize the dataset first.
dataset = pd.read_csv('salaries.csv')

#Scatter Plot
X = dataset['Years of Experience']
Y = dataset['Salary']

plt.scatter(X,Y,color='blue')
plt.xlabel('Years of Experience')
plt.ylabel('Salary')
plt.title('Salary Prediction Curves')
plt.show()
Finally, we calculated the unknown coefficients m as b1 and c as b0. Here we have b1 = 9449.962321455077 and b0 = 25792.20019866869.
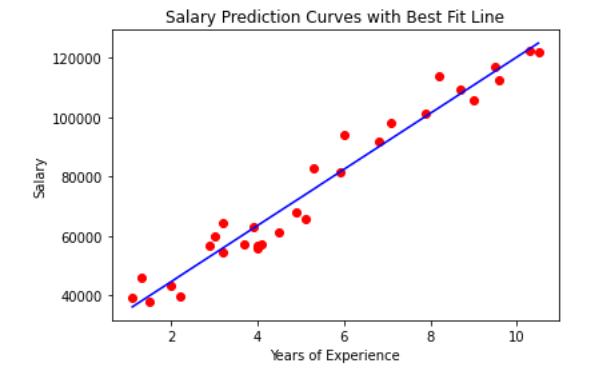
Let’s visualize the best-fit line from scratch. The code is available below.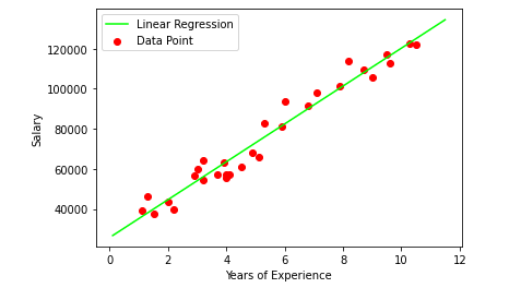
Now let’s predict the salary Y by providing years of experience as X:
def predict(x):
    return (b0 + b1 * x)
y_pred = predict(6.5)
print(y_pred)

Output: 87216.95528812669
LINEAR REGRESSION USING SKLEARN
from sklearn.linear_model import LinearRegression

X = dataset.drop(['Salary'],axis=1)
Y = dataset['Salary']

reg = LinearRegression()  #creating object reg
reg.fit(X,Y)     # Fitting the Data set
Let’s visualize the best-fit line using Linear Regression from sklearn. The code is available below.
Now let’s predict the salary Y by providing years of experience as X:
y_pred = reg.predict([[6.5]])
y_pred

Output: 87216.95528812669
CONCLUSION
We need to be able to measure how good our model is (accuracy). There are many methods to achieve this, but we would implement Root mean squared error and coefficient of Determination (R² Score).
- 1. Try a Model with Different error metrics for Linear Regression, like Mean Absolute Error and root mean squared error.
- 2. Try an algorithm with a large data set, an imbalanced & balanced dataset, to have all Regression flavors.


Hello! I just would like to give a huge thumbs up for the great info you have here on this post. I will be coming back to your blog for more soon.
I get pleasure from, cause I found just what I used to be having a look for.
You’ve ended my 4 day lengthy hunt! God Bless you man. Have a nice day.
Bye
I love your blog.. very nice colors & theme. Did
you create this website yourself or did you hire someone to do it for you?
Plz respond as I’m looking to create my own blog and
would like to know where u got this from.
thanks