Diabetes is a common chronic disease and poses a great threat to human health. The characteristic of diabetes is that the blood glucose is higher than the normal level, which is caused by defective insulin secretion or its impaired biological effects, or both. Diabetes can lead to chronic damage and dysfunction of various tissues, especially the eyes, kidneys, heart, blood vessels, and nerves. Diabetes can be divided into two categories, type 1 diabetes (T1D) and type 2 diabetes (T2D). Patients with type 1 diabetes are normally younger, mostly less than 30 years old.
The typical clinical symptoms are increased thirst and frequent urination, high blood glucose levels. This type of diabetes cannot be cured effectively with oral medications alone and the patients are required insulin therapy. Type 2 diabetes occurs more commonly in middle-aged and elderly people, which is often associated with the occurrence of obesity, hypertension, dyslipidemia, arteriosclerosis, and other diseases. So, let’s begin the project on Diabetes Prediction Using K-Means.
K-MEANS CLUSTERING
Cluster is defined as groups of data points such that data points in a group will be similar or related to one another and different from the data points of another group. And the process is known as clustering. The goal of clustering is to determine the intrinsic grouping in a set of unlabelled data. Clustering is a form of unsupervised learning since it doesn’t require labeled data.
K- means is an unsupervised partitional clustering algorithm that is based on grouping data into k – numbers of clusters by determining centroid using the Euclidean or Manhattan method for distance calculation. It groups the object based on minimum distance.

ALGORITHM
- 1. First, initialize the number of clusters, K (Elbow method is generally used in selecting the number of clusters )
- 2. Randomly select the k data points for centroid. A centroid is the imaginary or real location representing the center of the cluster.
- 3. Categorize each data items to its closest centroid and update the centroid coordinates calculating the average of items coordinates categorized in that group so far
- 4. Repeat the process for a number of iterations till successive iterations clusters data items into the same group
HOW IT WORKS ?
In the beginning, the algorithm chooses k centroids in the dataset randomly after shuffling the data. Then it calculates the distance of each point to each centroid using the euclidean distance calculation method. Each centroid assigned represents a cluster and the points are assigned to the closest cluster. At the end of the first iteration, the centroid values are recalculated, usually taking the arithmetic mean of all points in the cluster. In every iteration, new centroid values are calculated until successive iterations provide the same centroid value.
LET’S DIVE INTO CODE : Diabetes Prediction Using K-Means
The early diagnosis of the diabetes disease is a very important for cure process, and that provides an ease process of treatment for both the patient and the doctor. At this point, statistical methods and data mining algorithms can provide significance chances for early diagnosis of diabetes mellitus (DM).
IMPORTING DATASET & VISUALIZATION

Observations:
- There are a total of 768 records and 9 features in the dataset.
- Each feature can be either of integer or float data type.
- Some features like Glucose, Blood pressure, Insulin, BMI have zero values which represent missing data.
- There are zero NaN values in the dataset.
- In the outcome column, 1 represents diabetes positive and 0 represents diabetes negative.

Observations:
1.The count plot tells us that the dataset is imbalanced, as the number of patients who don’t have diabetes is more than those who do.
2.From the correlation heatmap, we can see that there is a high correlation between Outcome and [Glucose, BMI, Age]. We can select these features to accept input from the user and predict the outcome in Diabetes Prediction Using K-Means.
FINDING BEST K BY ELBOW METHOD
While working with the k-means clustering scratch, one thing we must keep in mind is the number of clusters ‘k’. We should make sure that we are choosing the optimum number of clusters for the given data set. But, here arises a question, how to choose the optimum value of k ?? We use the elbow method which is generally used in analyzing the optimum value of k.
The Elbow method is based on the principle that “Sum of squares of distances of every data point from its corresponding cluster centroid should be as minimum as possible”.
STEPS OF CHOOSING BEST K VALUE
- Run k-means clustering model on various values of k
- For each value of K, calculate the Sum of squares of distances of every data point from its corresponding cluster centroid which is called WCSS ( Within-Cluster Sums of Squares)
- Plot the value of WCSS with respect to various values of K
- To select the value of k, we choose the value where there is bend (knee) on the plot i.e. WCSS isn’t increasing rapidly.
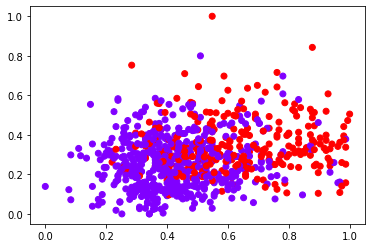
Since we need to cluster diabetes & Non Diabetes, cluster = 2 for our problem Scenario

Diabetes Prediction Using K-Means